Getting started#
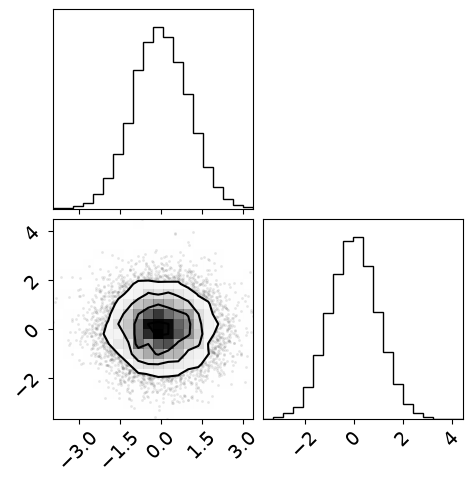
The only user-facing function in the module is corner.corner and, in its simplest form, you use it like this:
import corner
import numpy as np

ndim, nsamples = 2, 10000
np.random.seed(42)
samples = np.random.randn(ndim * nsamples).reshape([nsamples, ndim])
figure = corner.corner(samples)
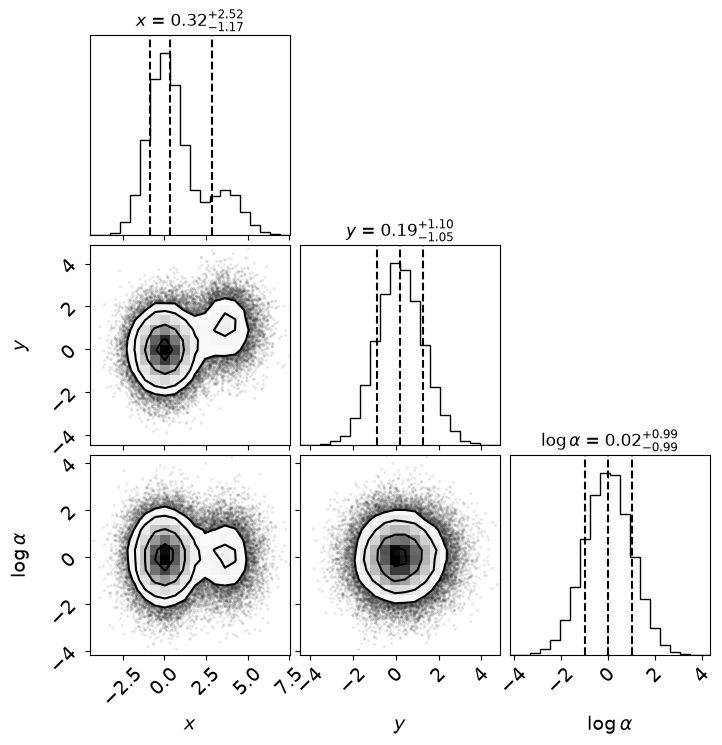
The following snippet demonstrates a few more bells and whistles:
# Set up the parameters of the problem.
ndim, nsamples = 3, 50000

# Generate some fake data.
np.random.seed(42)
data1 = np.random.randn(ndim * 4 * nsamples // 5).reshape(
    [4 * nsamples // 5, ndim]
)
data2 = 4 * np.random.rand(ndim)[None, :] + np.random.randn(
    ndim * nsamples // 5
).reshape([nsamples // 5, ndim])
data = np.vstack([data1, data2])

# Plot it.
figure = corner.corner(
    data,
    labels=[
        r"$x$",
        r"$y$",
        r"$\log \alpha$",
        r"$\Gamma \, [\mathrm{parsec}]$",
    ],
    quantiles=[0.16, 0.5, 0.84],
    show_titles=True,
    title_kwargs={"fontsize": 12},
)
The API documentation gives more details about all the arguments available for customization.